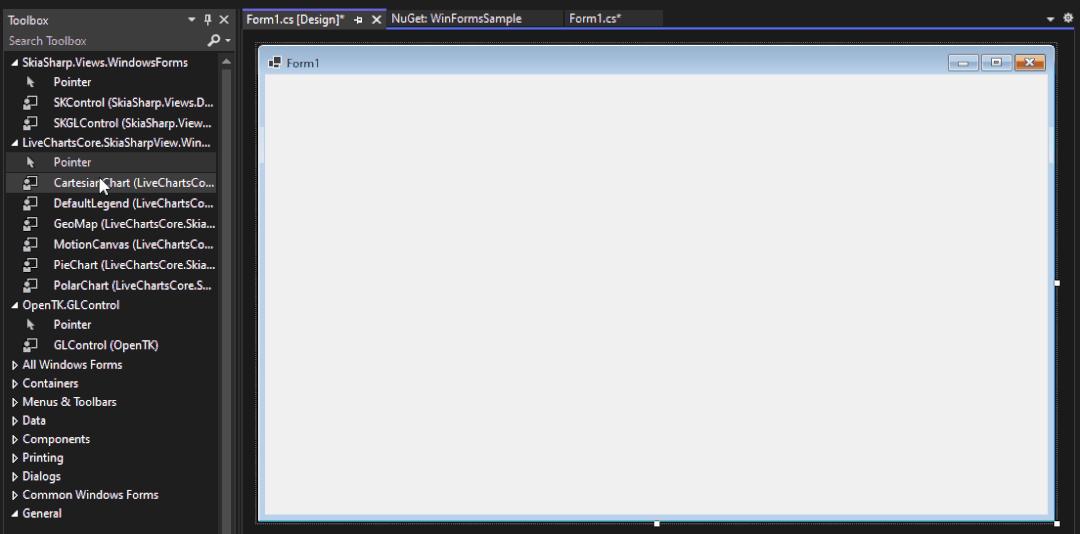
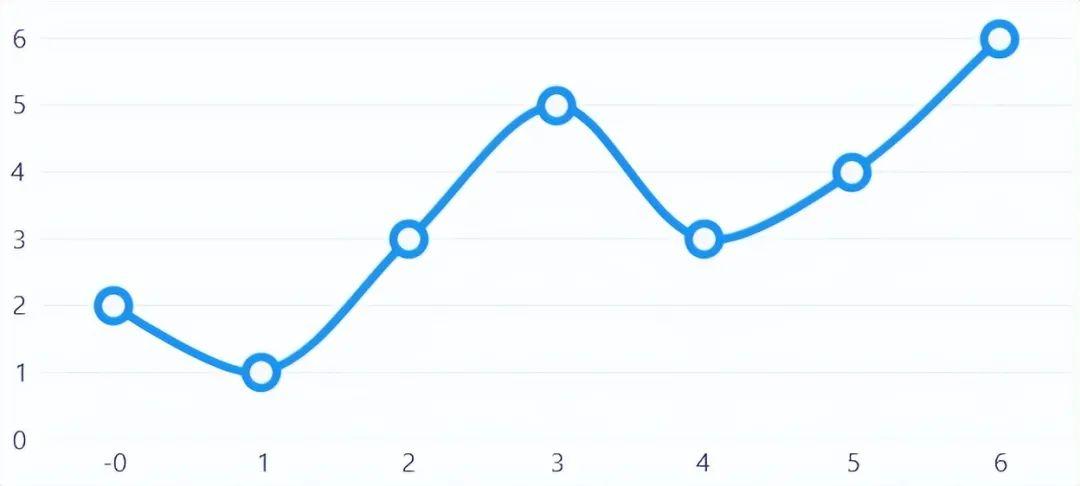
3、第一张图表
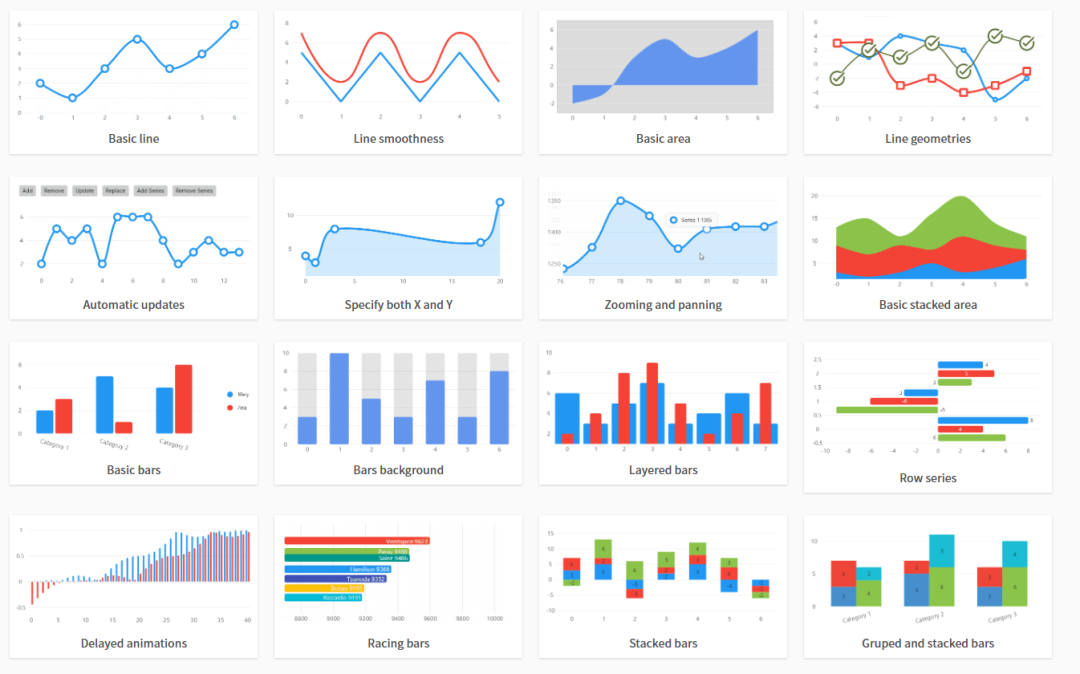
基本线图表例子
using LiveChartsCore;
using LiveChartsCore.SkiaSharpView;
namespace WinFormsSample
{
public partial class Form1 : Form
{
public Form1()
{
InitializeComponent();
cartesianChart1.Series = new ISeries[]
{
new LineSeries<double>
{
Values = new double[] { 2, 1, 3, 5, 3, 4, 6 },
Fill = null
}
};
}
}
}4、配置图表主题
在项目启动入口配置主题,设置代码如下:
using System;
using System.Windows.Forms;
using LiveChartsCore;
using LiveChartsCore.SkiaSharpView;
namespace WinFormsSample
{
static class Program
{
[STAThread]
static void Main()
{
_ = Application.SetHighDpiMode(HighDpiMode.SystemAware);
Application.EnableVisualStyles();
Application.SetCompatibleTextRenderingDefault(false);
Application.Run(new Form1());
LiveCharts.Configure(config =>
config
// registers SkiaSharp as the library backend
// REQUIRED unless you build your own
.AddSkiaSharp()
// adds the default supported types
// OPTIONAL but highly recommend
.AddDefaultMappers()
// select a theme, default is Light
// OPTIONAL
//.AddDarkTheme()
.AddLightTheme()
// finally register your own mappers
// you can learn more about mappers at:
// ToDo add website link...
.HasMap<City>((city, point) =>
{
point.PrimaryValue = city.Population;
point.SecondaryValue = point.Context.Index;
})
// .HasMap<Foo>( .... )
// .HasMap<Bar>( .... )
);
}
}
}图表样式


 发表于 2022-9-23 14:08:32